Author : Anne Goodall
This report covers the period April 2009 to September 2012, ie the Lincolnshire surveys for Summer 2009, 2010, 2011 and 2012, and for Winter 2009/10, 2010/11 and 2011/12. Most of the data are therefore provided as tables, with comments on particularly interesting findings and trends.
Background
The Lincolnshire Garden Bird Survey started over the winter of 1985/86, and winter surveys have run every year since that time. Summer surveys were first attempted in 1996 and 1997, but then lapsed. They began again in 2003, and have run every year since. The basic requirement, to report the maximum number of birds of each species seen during the week has not changed, but for the first ten years, surveyors were required to report the species and maximum number feeding each week; from 1995/96 this was relaxed to the number using the garden. In practice this change made very little difference to the numbers of birds recorded, but clarified the position over birds not actually seen to take food while being watched.
Contributors Statistics - summary tables
Table 1 (Appendix) shows the number of gardens contributing to each summer survey, the total number of species recorded over all gardens, the lowest and highest number recorded in individual gardens, the mean over all gardens, and the mean number of weeks for which the gardens were watched (out of 26). The averages for each parameter over the decade 2003-2012 are also shown.
Table 2 (Appendix) gives the same information for the winter surveys, with the average figures for winters 2002/03 to 2011/12.
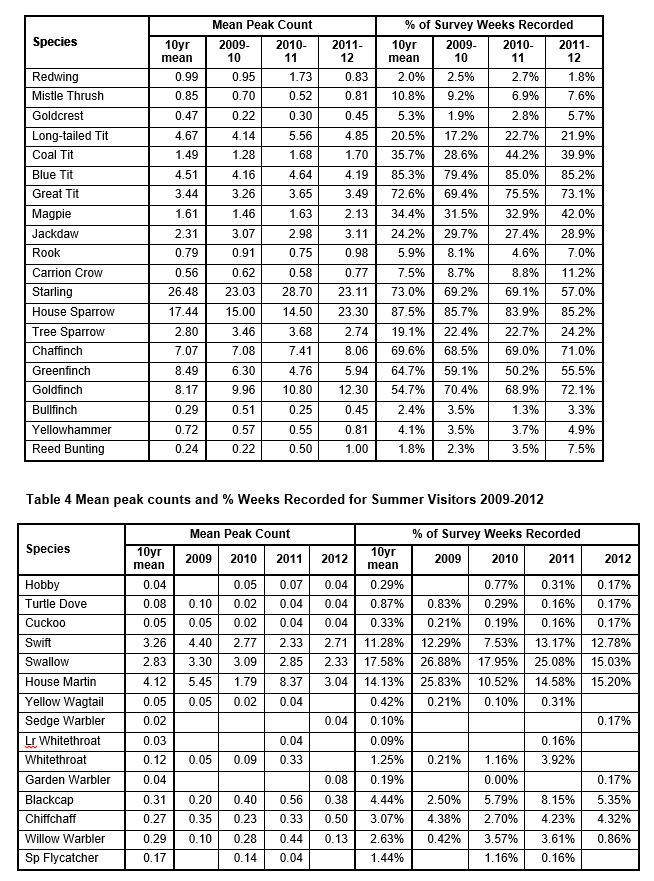
Table 3 (Appendix) shows the mean peak count and the percentage of total survey weeks in which each species was recorded for the 33 most widespread species. All of these were recorded in at least a quarter of the gardens surveyed in at least one of the last 3 winters. For both tables, the first column in each half of the table gives the figures for the mean of that parameter over the ten years 2002-03 to 2011-12. Comparing the figures for the last three winters with this mean indicates the medium-term trend. Examples of the main trends are shown in Figures 3-7, following.
Table 4 (Appendix) gives the summary statistics (as for Table 3) for the 15 summer visitors most regularly recorded in gardens. For nearly half of these, records in this smaller selection of gardens are rather sporadic, although for some, this is now an indication of how scarce they have become across the county and UK. See below for further discussion.
Gardens surveyed and their locations within Lincolnshire
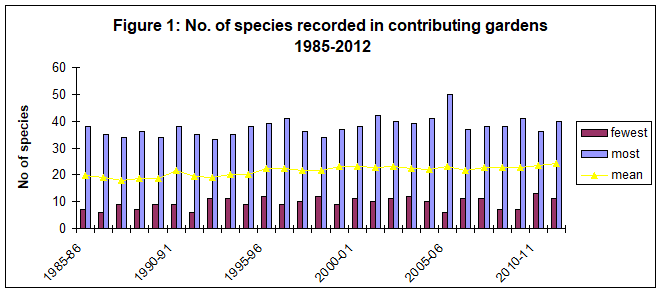
Figure 2 shows the location of the 108 gardens, located in 92 1km OS grid squares, which were surveyed over the period of this report. Their distribution is shown by 10km square; the shading indicates that the distribution of contributors reasonably mirrors the distribution of population.

Figure 2. Distribution of gardens included in the surveys 2009-2012
Winter Garden Bird Statistics and Trends
The major use of the records received from surveyors is to calculate annually two figures. The mean peak count is the sum of each contributor’s peak count for each species, including zeros for the gardens where the species was not recorded, divided by the total number of gardens surveyed in that winter. Multiplying this figure by 100 standardises it as the count/100 gardens, and year on year comparison shows changes in the size of the wintering population, for species which make use of gardens at this season. The percentage of survey weeks recorded sums the number of weeks a species was recorded in every garden taking part, and divides this by the total number of weeks when gardens were actually watched, expressing the value as a percentage. (This allows for survey gaps for holidays, etc.) Since locally common species, present in only a few gardens every week, would give a similar figure to widespread species occasionally using gardens across the county, interpretation of this index does require an understanding of the distribution and habitat needs of each species.
For both indices, interpretation for a particular species also involves consideration of a range of factors, such as flocking v solitary behaviour; residents v migrants; irruptions; winter territoriality (including the ‘guarding’ of berry bushes, usually by thrushes); effect of weather; size and location of gardens surveyed, etc. However, providing enough gardens are surveyed (ideally at least 100) each year, and that distribution across the natural regions and between town and country gardens remains reasonably constant, then the indices can be used to examine trends. The latter requirement has been met over the 26 years of the survey to date, but it should be noted that the number of contributors was down to only half the long-term average in 2011-12 winter.
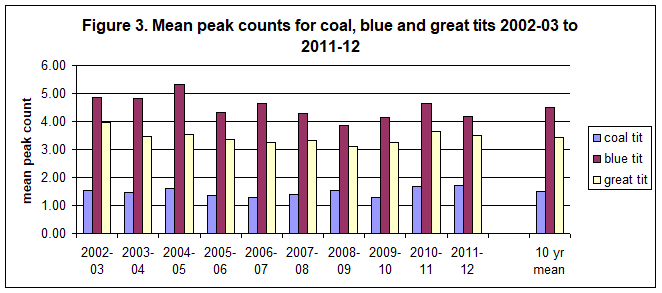
Many of these 33 species appear to have been fairly stable, or fluctuated in a narrow band around a mean value, over the last decade or longer in Lincolnshire gardens. Species for which both indices have behaved in this way through the whole of the survey period, from 1985-86 to 2011-12, are robin, blackbird, coal tit, blue tit, great tit, carrion crow and chaffinch. Figure 3 shows the annual mean peak values for the three tit species over the last decade. In these species there is a suggestion of cycles over this period, and also that the peaks for each species are coincident. These cycles may be weather-related, possibly reflecting productivity in the previous breeding season.
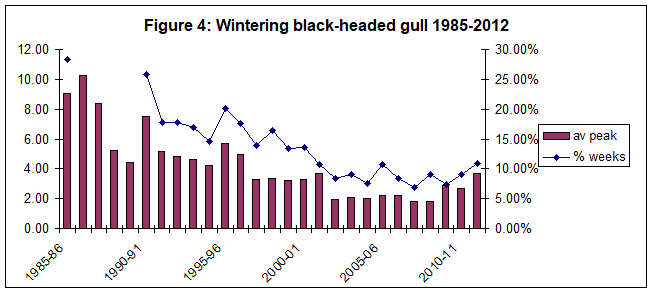
The indices for four species, sparrowhawk, pheasant, collared dove and magpie, have been relatively stable for the last decade, following earlier increases from the start of the survey in all cases. Conversely, black-headed gull and bullfinch are currently stable following declines from the start of the survey. Figure 4 shows the indices for black-headed gull as an example of this.
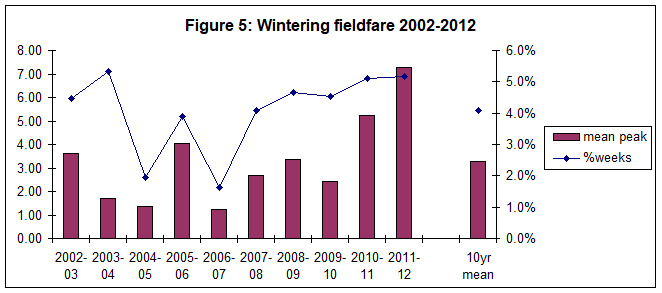
Another group of species show continuous larger fluctuations in their indices. This happens most obviously in migrants, such as fieldfare (Figure 5) and redwing , where the numbers of birds either passing through or staying in the county vary both from year to year, and region to region. Although not included in this group of target species (since their numbers are much lower in most years) waxwing, brambling, siskin and crossbill also show this kind of pattern as do partial migrants such as goldcrest, where the numbers arriving often greatly outnumber the residents.
Other species whose numbers and use of gardens fluctuates over a wide range are great spotted woodpecker, rook, yellowhammer and reed bunting. The last of these is currently in the upswing of a fluctuation, while rooks appear to have a 6-12 year cycle in their fluctuations. It is likely that all of these swings are weather-related, but not impossible that numbers of some of these species are also augmented by arrivals in some winters.
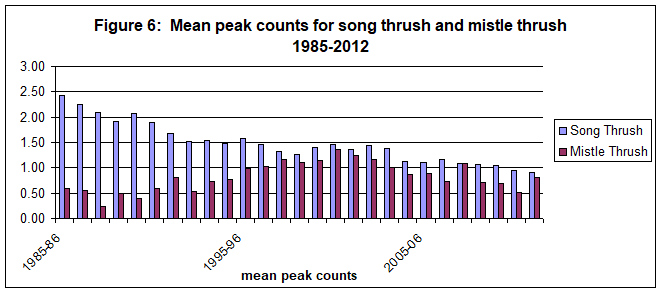
A third group of species have been declining steadily, either over recent years, having previously been stable, such as pied wagtail, wren and greenfinch: or from the beginning of the survey, as in song thrush, starling and house sparrow: or following a peak, as in mistle thrush. Figure 6 shows the contrasting patterns for song and mistle thrush over the whole survey period.
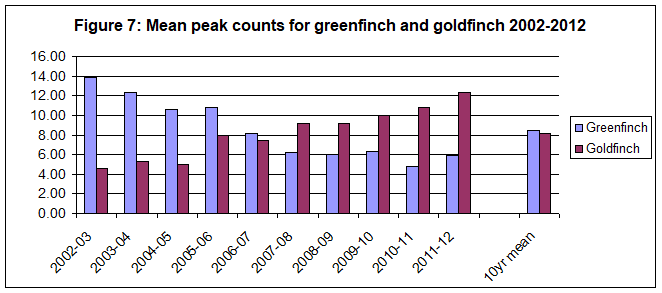
Finally, there are five species, woodpigeon, long-tailed tit, jackdaw, tree sparrow and goldfinch which, having previously been stable at a lower level, have been increasing through the last decade. Figure 7 contrasts the differing fortunes of greenfinch and goldfinch in gardens over this period. According to BTO reports, finch trichomonosis was first noted in the UK in 2005, with widespread mortality in greenfinches, mainly in the West Midlands, recorded in 2006; from here it spread east in 2007 and 2008. Figure 7 shows though that the decline had already begun before this, with the Lincolnshire peak in winter 2002-03. Goldfinch numbers in gardens actually began to increase a year or two before this.
Summer Garden Bird Statistics and Trends
The summer survey both supplements winter recording by covering the late winter ‘hungry gap’ and the pre-breeding periods for several species, and also provides information on summer visitors and on use of gardens for breeding. Unfortunately, it is less well supported than the winter survey, so these aspects are less robust than they could be.
Use of gardens over the full year is best shown by summing the weekly counts for each species in all gardens watched over this period. Since not all winter contributors also survey through the summer, both winter and summer counts are standardised at weekly peak counts per 100 gardens. Figures 8-10 demonstrate this method for three species with peak use of gardens in late spring-summer. Figure 8 shows that few gardens now record song thrushes through the mid-winter period, but that numbers tend to build up from January, with peak use in April-May-June, then drop off quickly after July. The peaks may represent breeding attempts, with adults using food in gardens for themselves, while foraging for their nestlings, and then the young birds using the same source. It seems that song thrushes can find enough natural food from late summer onward, when berries, seeds and nuts supplement earthworms and molluscs.
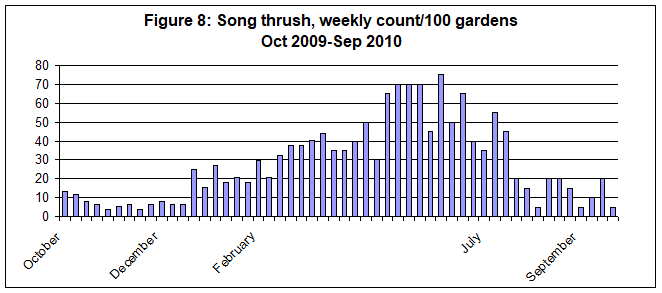
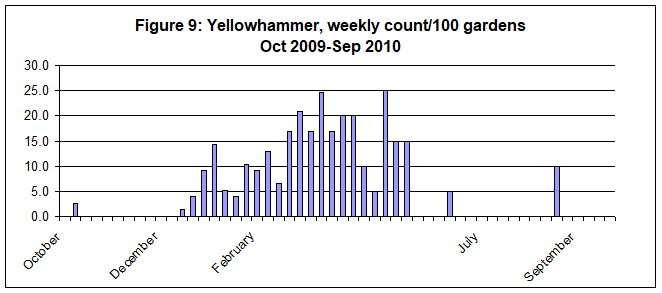
Figure 9 shows use of gardens by yellowhammers, peaking in April and May to cover the hungry gap, when autumn and winter food sources are scarce and before weed and tree seeds and fruits become available again. Yellowhammers are late breeders, so these will be adults, using gardens to get into breeding condition. The actual numbers recorded by this survey tend to be small, since this species is most likely to find gardens backing onto arable land, but numbers in each of these gardens can be high, demonstrating the importance of this resource for this species at this season. This pattern is typical of other seed-feeders, including goldfinch, siskin, bullfinch and reed bunting. Plotting annual siskin patterns in this way is particularly interesting in demonstrating the effect of siskin ‘irruptions’; combined with ringing records and general reporting, these records improve the monitoring of the size and duration of such invasions.
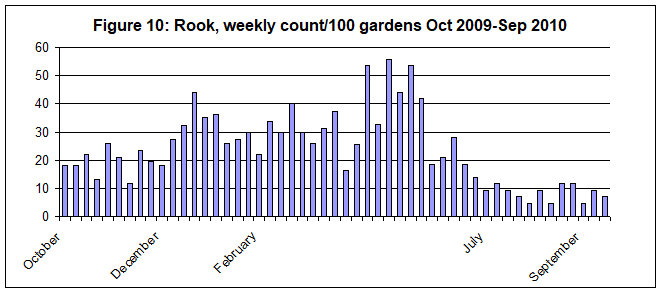
A more complex use of gardens is made by rooks, shown in Figure 10. The three peaks seen here probably relate to use of gardens when the ground is hardest in mid-winter (January in 2009-10), early spring (late February-March-early April) when the birds are building, laying, and feeding themselves while taking soil invertebrates to their young, and May, when the young birds are out of the nest and learning to forage for themselves. Some gardens in the survey are clearly close to a rookery, and record rooks all year; since not all of these continue recording through the summer, it is likely that the April-May peaks are actually underestimated in this figure.
Turning to monitoring of summer visitors, Table 4 (Appendix) gives the summary statistics (as for Table 3) for the 15 species most regularly recorded in gardens. For nearly half of these, records in this smaller selection of gardens are rather sporadic, although for some, this is now an indication of how scarce they have become across the county and UK: examples are shown in Figures 11 and 12. Note the difference in the scales: turtle doves are typically birds of farmland scrub and small woods, while spotted flycatchers often also occur in suburban gardens and parks, so have in the past been more widely recorded. The figures show that both species were more common ten years ago, and though they have had some reasonable years since, the overall trend has been downward, in line with UK trends.
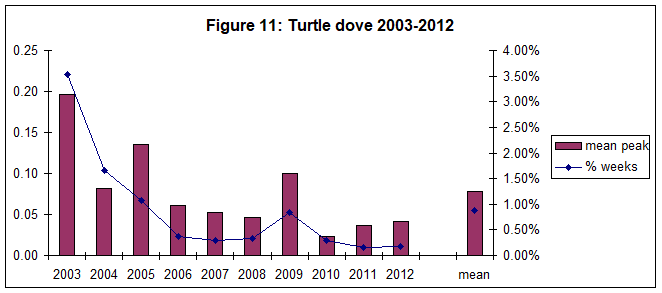
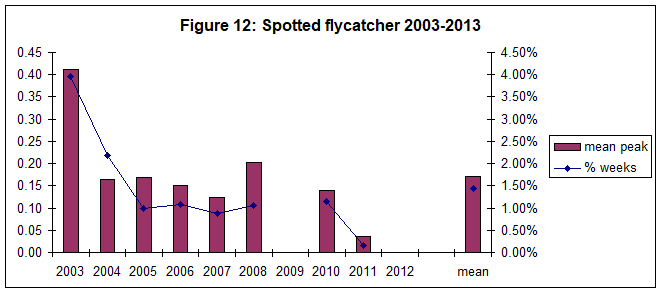
Figure 13 compares annual peak count data for two related species, house martin and swallow. Contributors regularly report that one or other has been scarce in their area in a particular year, and the former especially has shown some large fluctuations, but over the last ten years it would appear that numbers across the county as a whole have been stable. There is some suggestion that summer 2008 was poor for both species, as it seems to have been for turtle dove, and possibly for summer visitors more generally.
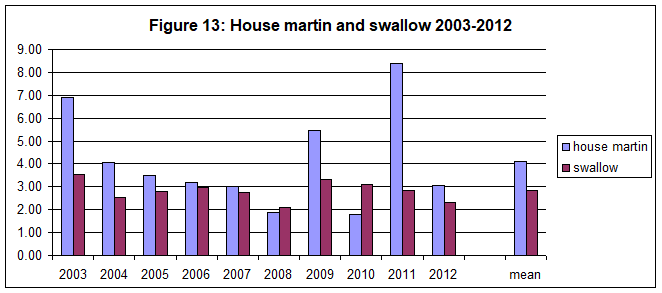
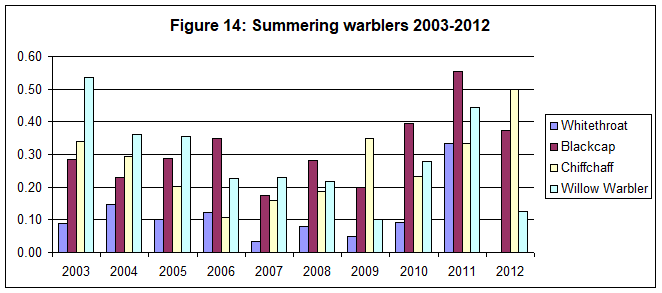
Figure 14 provides a similar comparison for the four most regular warblers recorded in gardens, and though these all show quite wide fluctuations, possibly cycles in some cases, across the decade, all seem to have had low numbers in at least one of the years 2006-2008.
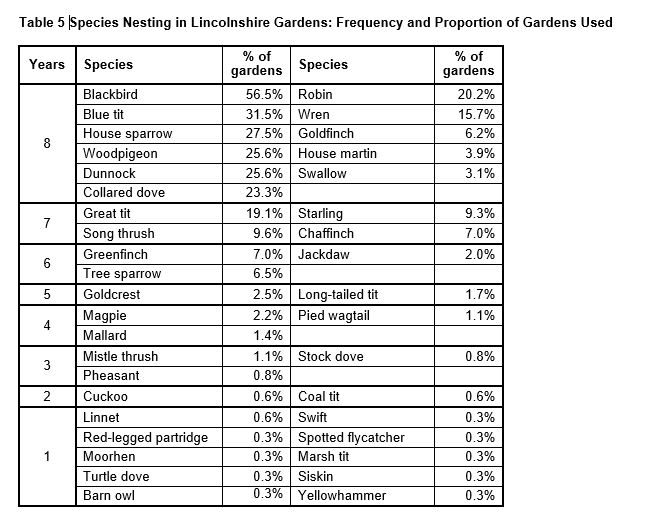
In 2003, contributors were also asked to tick a column indicating which species had nested (ie, made a nest and laid eggs, even if the nest then failed) in their gardens that year. This wasn’t repeated in 2004 or 2005, but the information has been requested every year since 2006. For the 38 species recorded as breeding in the surveyed gardens during these years, Table 5 shows how many years out of the possible eight each species was recorded in at least one garden, and, on average, the proportion of gardens in which that species nests each year. This last figure is only very approximate, both since the numbers of contributors in some years was very small (and many of the same gardens were represented in several years) and also because unfortunately, contributors were NOT asked to tick a box stating that no birds nested in their garden. The assumption has been made that if no box was ticked, no species nested, but this need not have been so, making the figures conservative. However, they do indicate that blackbirds are the most widespread breeding bird in gardens, followed by blue tit, and with woodpigeon, collared dove, robin, dunnock, great tit and house sparrow all nesting in around 20-25% of gardens annually over the last decade. Comparing the annual figures shows that while numbers nesting for most species have remained fairly steady over the decade, for others the figures parallel the change in mean counts. For example, from 2003-2007, wrens were recorded nesting from around 20% of gardens each year, but since then this figure has dropped steadily to less than 10%. Conversely, jackdaws were not recorded nesting in gardens until 2006-2007, and have increased to around 5% of gardens in 2011 and 2012.
Conclusion and Acknowledgements
This brief summary has hopefully shown just how much information is provided by this relatively simple survey, and the different ways in which it can be used to monitor many of our common birds. LBC has undertaken to monitor and report on population trends for the birds included in the Lincolnshire Biodiversity Action Plan, and this information could not have been provided without the efforts of those who have surveyed the 452 gardens included in the database since 1985. Your contributions, including the notes and summaries many of you provide, are most gratefully acknowledged. Please keep it up!
In most years, some 60-70 species are recorded in contributing gardens, although only around half of these are recorded in enough gardens to provide reasonably robust trends. We really need at least twice as many contributors to improve on this, and ideally even more than this, since unfortunately so many of these ‘common’ birds are declining. If you can help, please join us.
Appendix
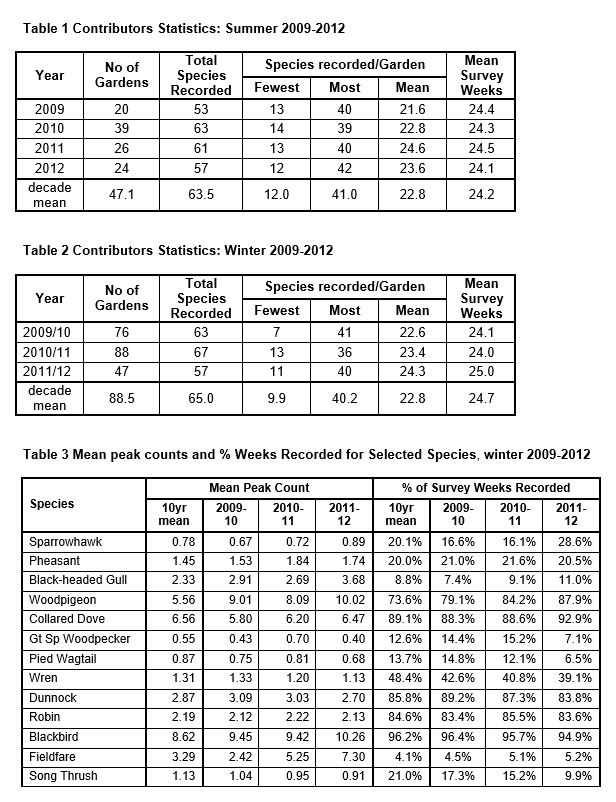 Table 3 (cont) Mean peak counts and % Weeks Recorded For Selected Species, winter 2009-12